telemetry.dev is an LLM observability platform built for AI applications and agents. It launched on Product Hunt on October 31, 2026, and this post is based on its official website, checked on November 1, 2026.
What telemetry.dev does
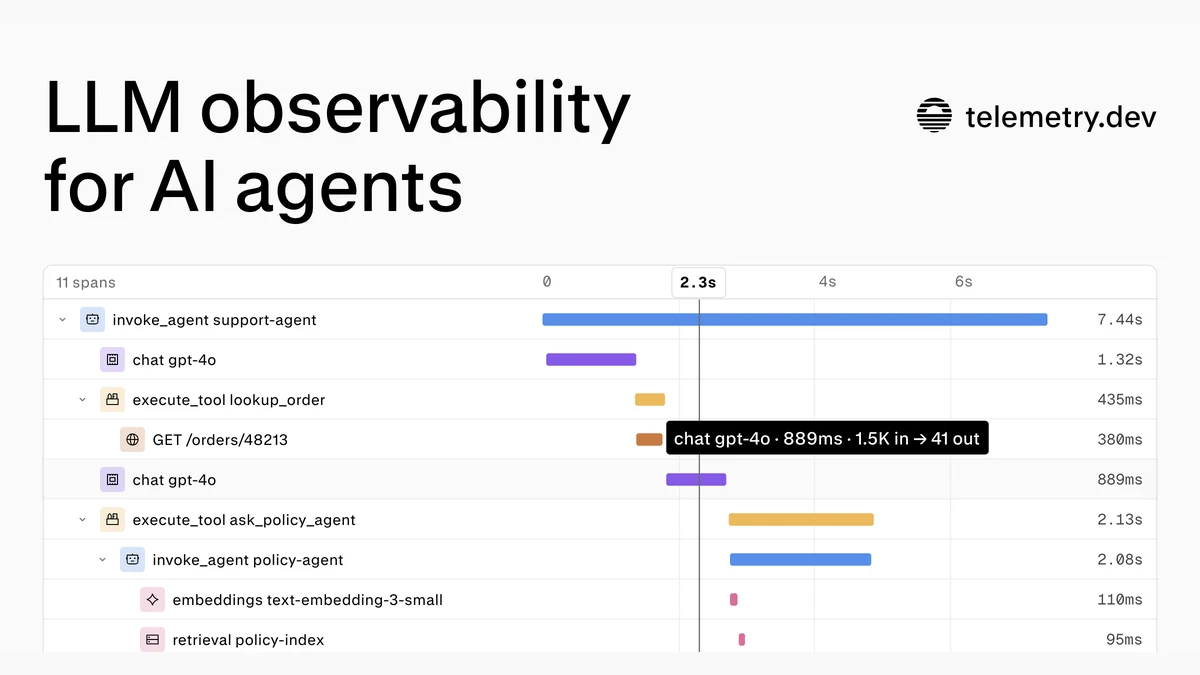
Each agent run becomes one trace. Inside it, every model call, tool step, and retrieval is a span with its duration, so you can follow a support-agent run and see exactly which step was slow or which call failed. Token usage, cost, latency, and errors are reported per span, and a cost overview breaks spend down by model, provider, and environment.
The new launch adds prompt management, evals, and alerts on top of tracing: email alerts for cost, budgets, agent loops, and model or tool errors, so you hear about a problem before your users do. A read-only MCP server lets your own AI agent investigate errors, latency, and cost through the platform, and there is an MCP analytics view showing span counts, failures, and p95 duration per tool, from both client and server.
How it connects
The platform is built on OpenTelemetry. TypeScript and Python get first-party SDKs, with integrations for OpenAI, Anthropic, and the Vercel AI SDK, and any other language can send standard OTLP over HTTP. Privacy controls let you turn off prompt capture per environment before storage, with built-in and project-specific redaction patterns.
Who it is for
telemetry.dev is built for teams shipping agents and LLM features to production: developers debugging a failing agent run, founders watching token spend, and platform teams that need one place to see cost, latency, and reliability across models and environments.
Pricing
The Free plan costs $0 and requires no credit card: it includes 30,000 ingestion units per month, 14-day retention, one project, and two seats. Paid plans are available for larger usage. Prices may change, so check the official website for the latest pricing: https://telemetry.dev/.